Premature mortality and ethnicity
Interpreting linked Census and death-registration evidence on premature mortality in England

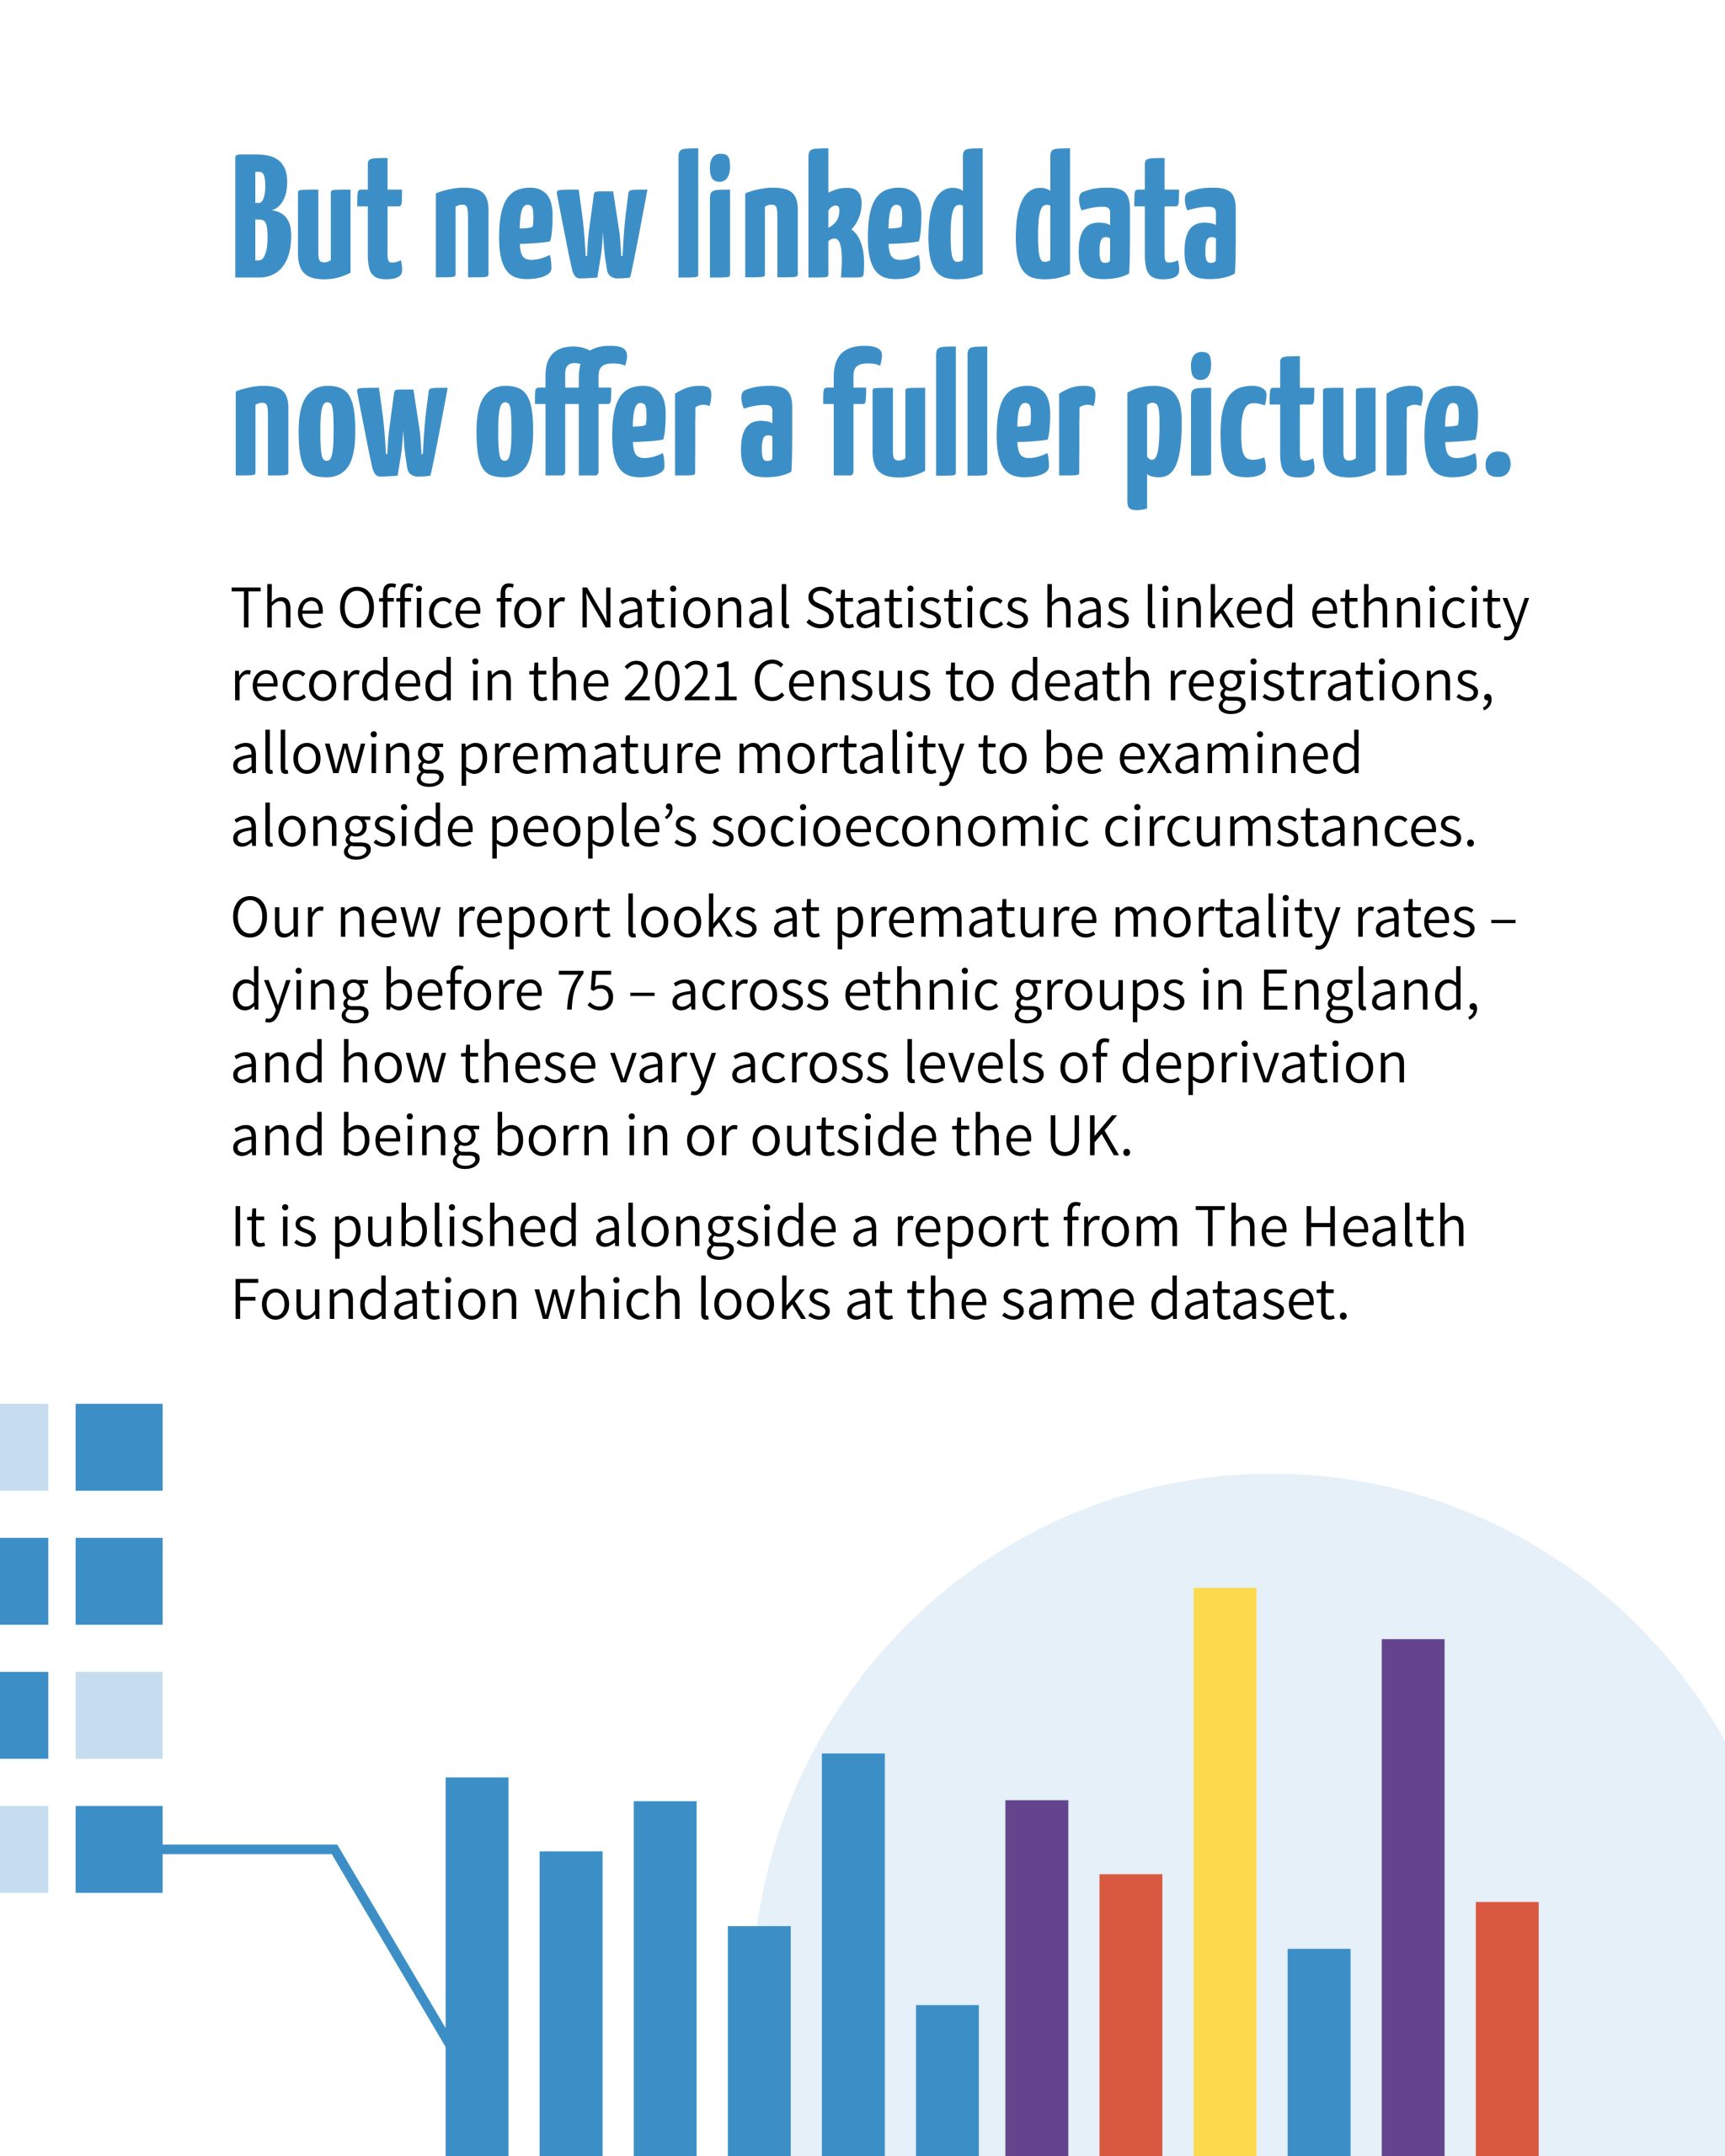
The Office for National Statistics (ONS) has linked 2021 Census ethnicity to death registrations. With support from The Health Foundation, our new report looks at premature mortality rates across ethnic groups in England, and how these vary across wider determinants of health.
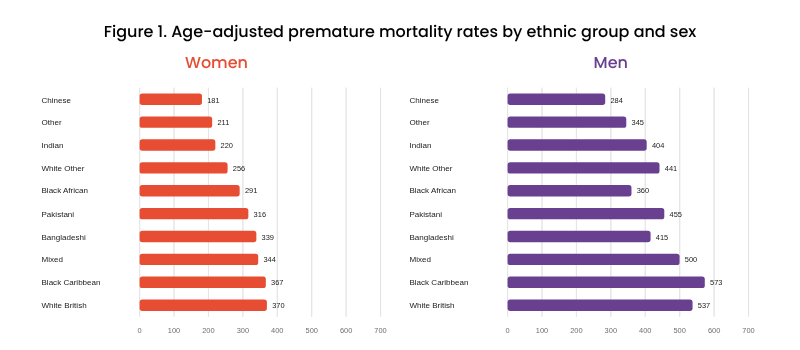
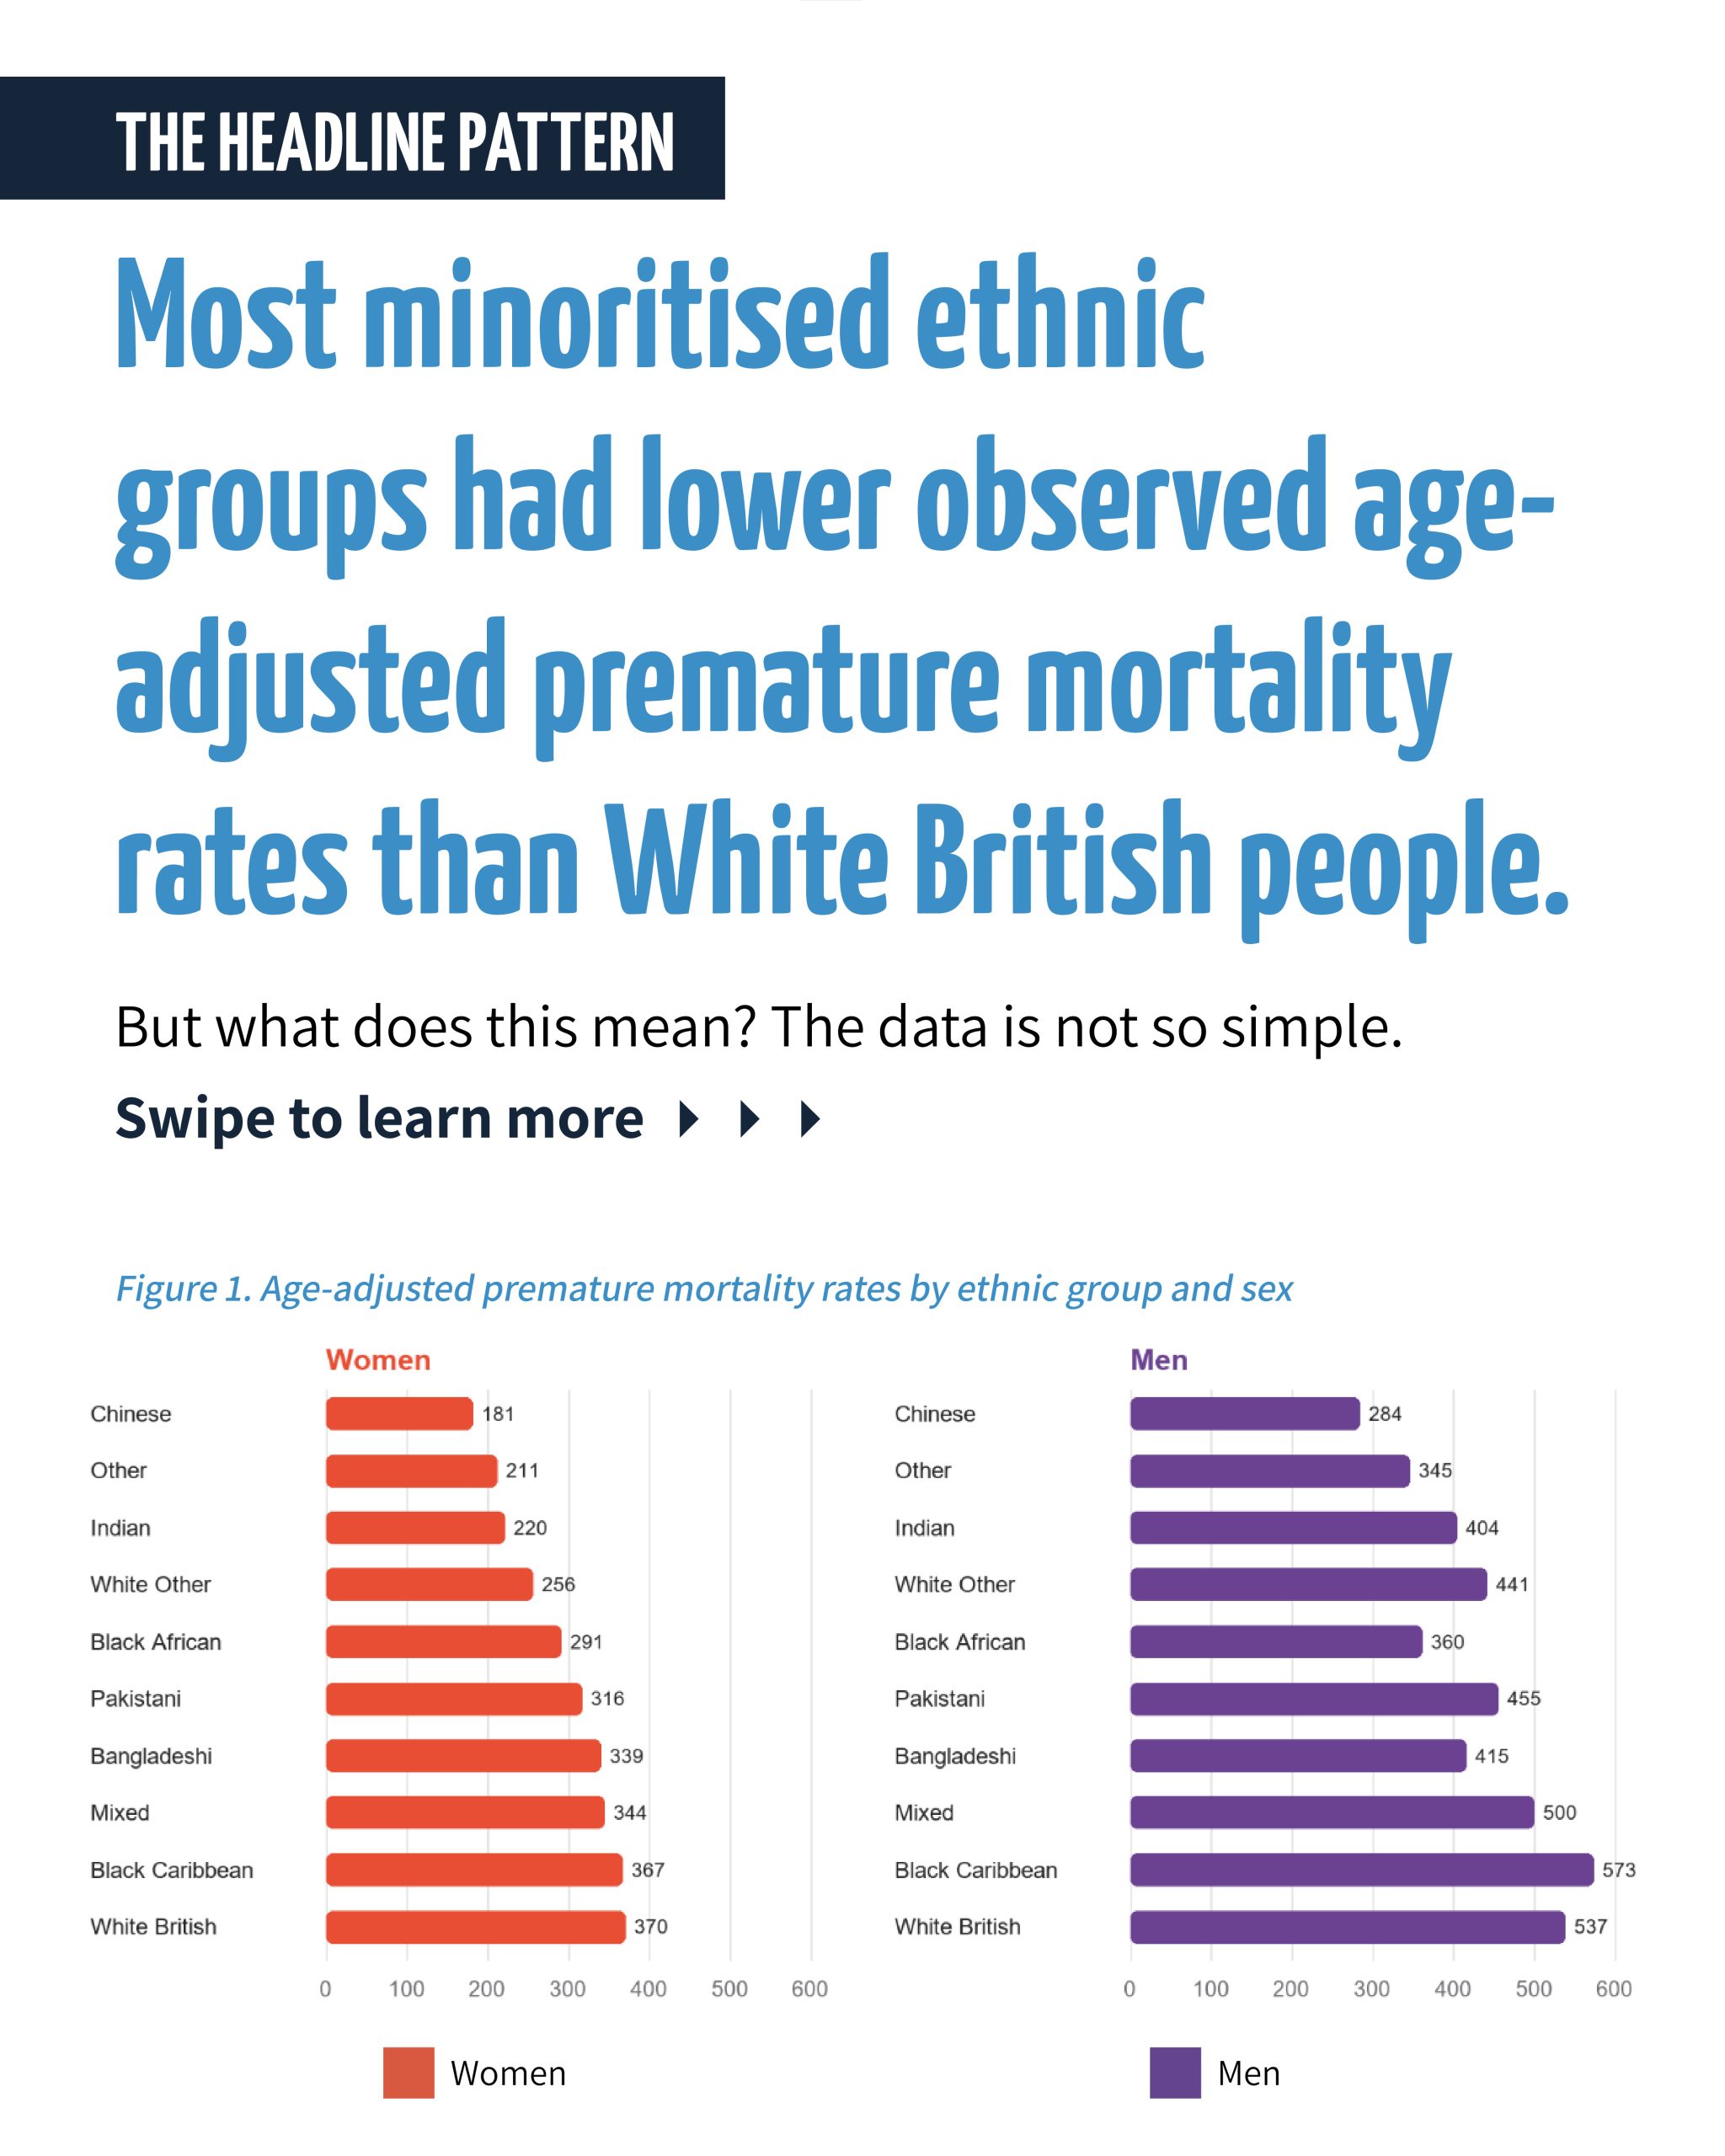
The data shows that most Black, Asian and minoritised ethnic groups have lower premature mortality than White British people. Our report asks how that pattern should be understood.
The report is published alongside analysis from The Health Foundation of the same data, which has a focus on socioeconomic inequalities.
Explore the report
Swipe through our carousel for a short guide to the report.
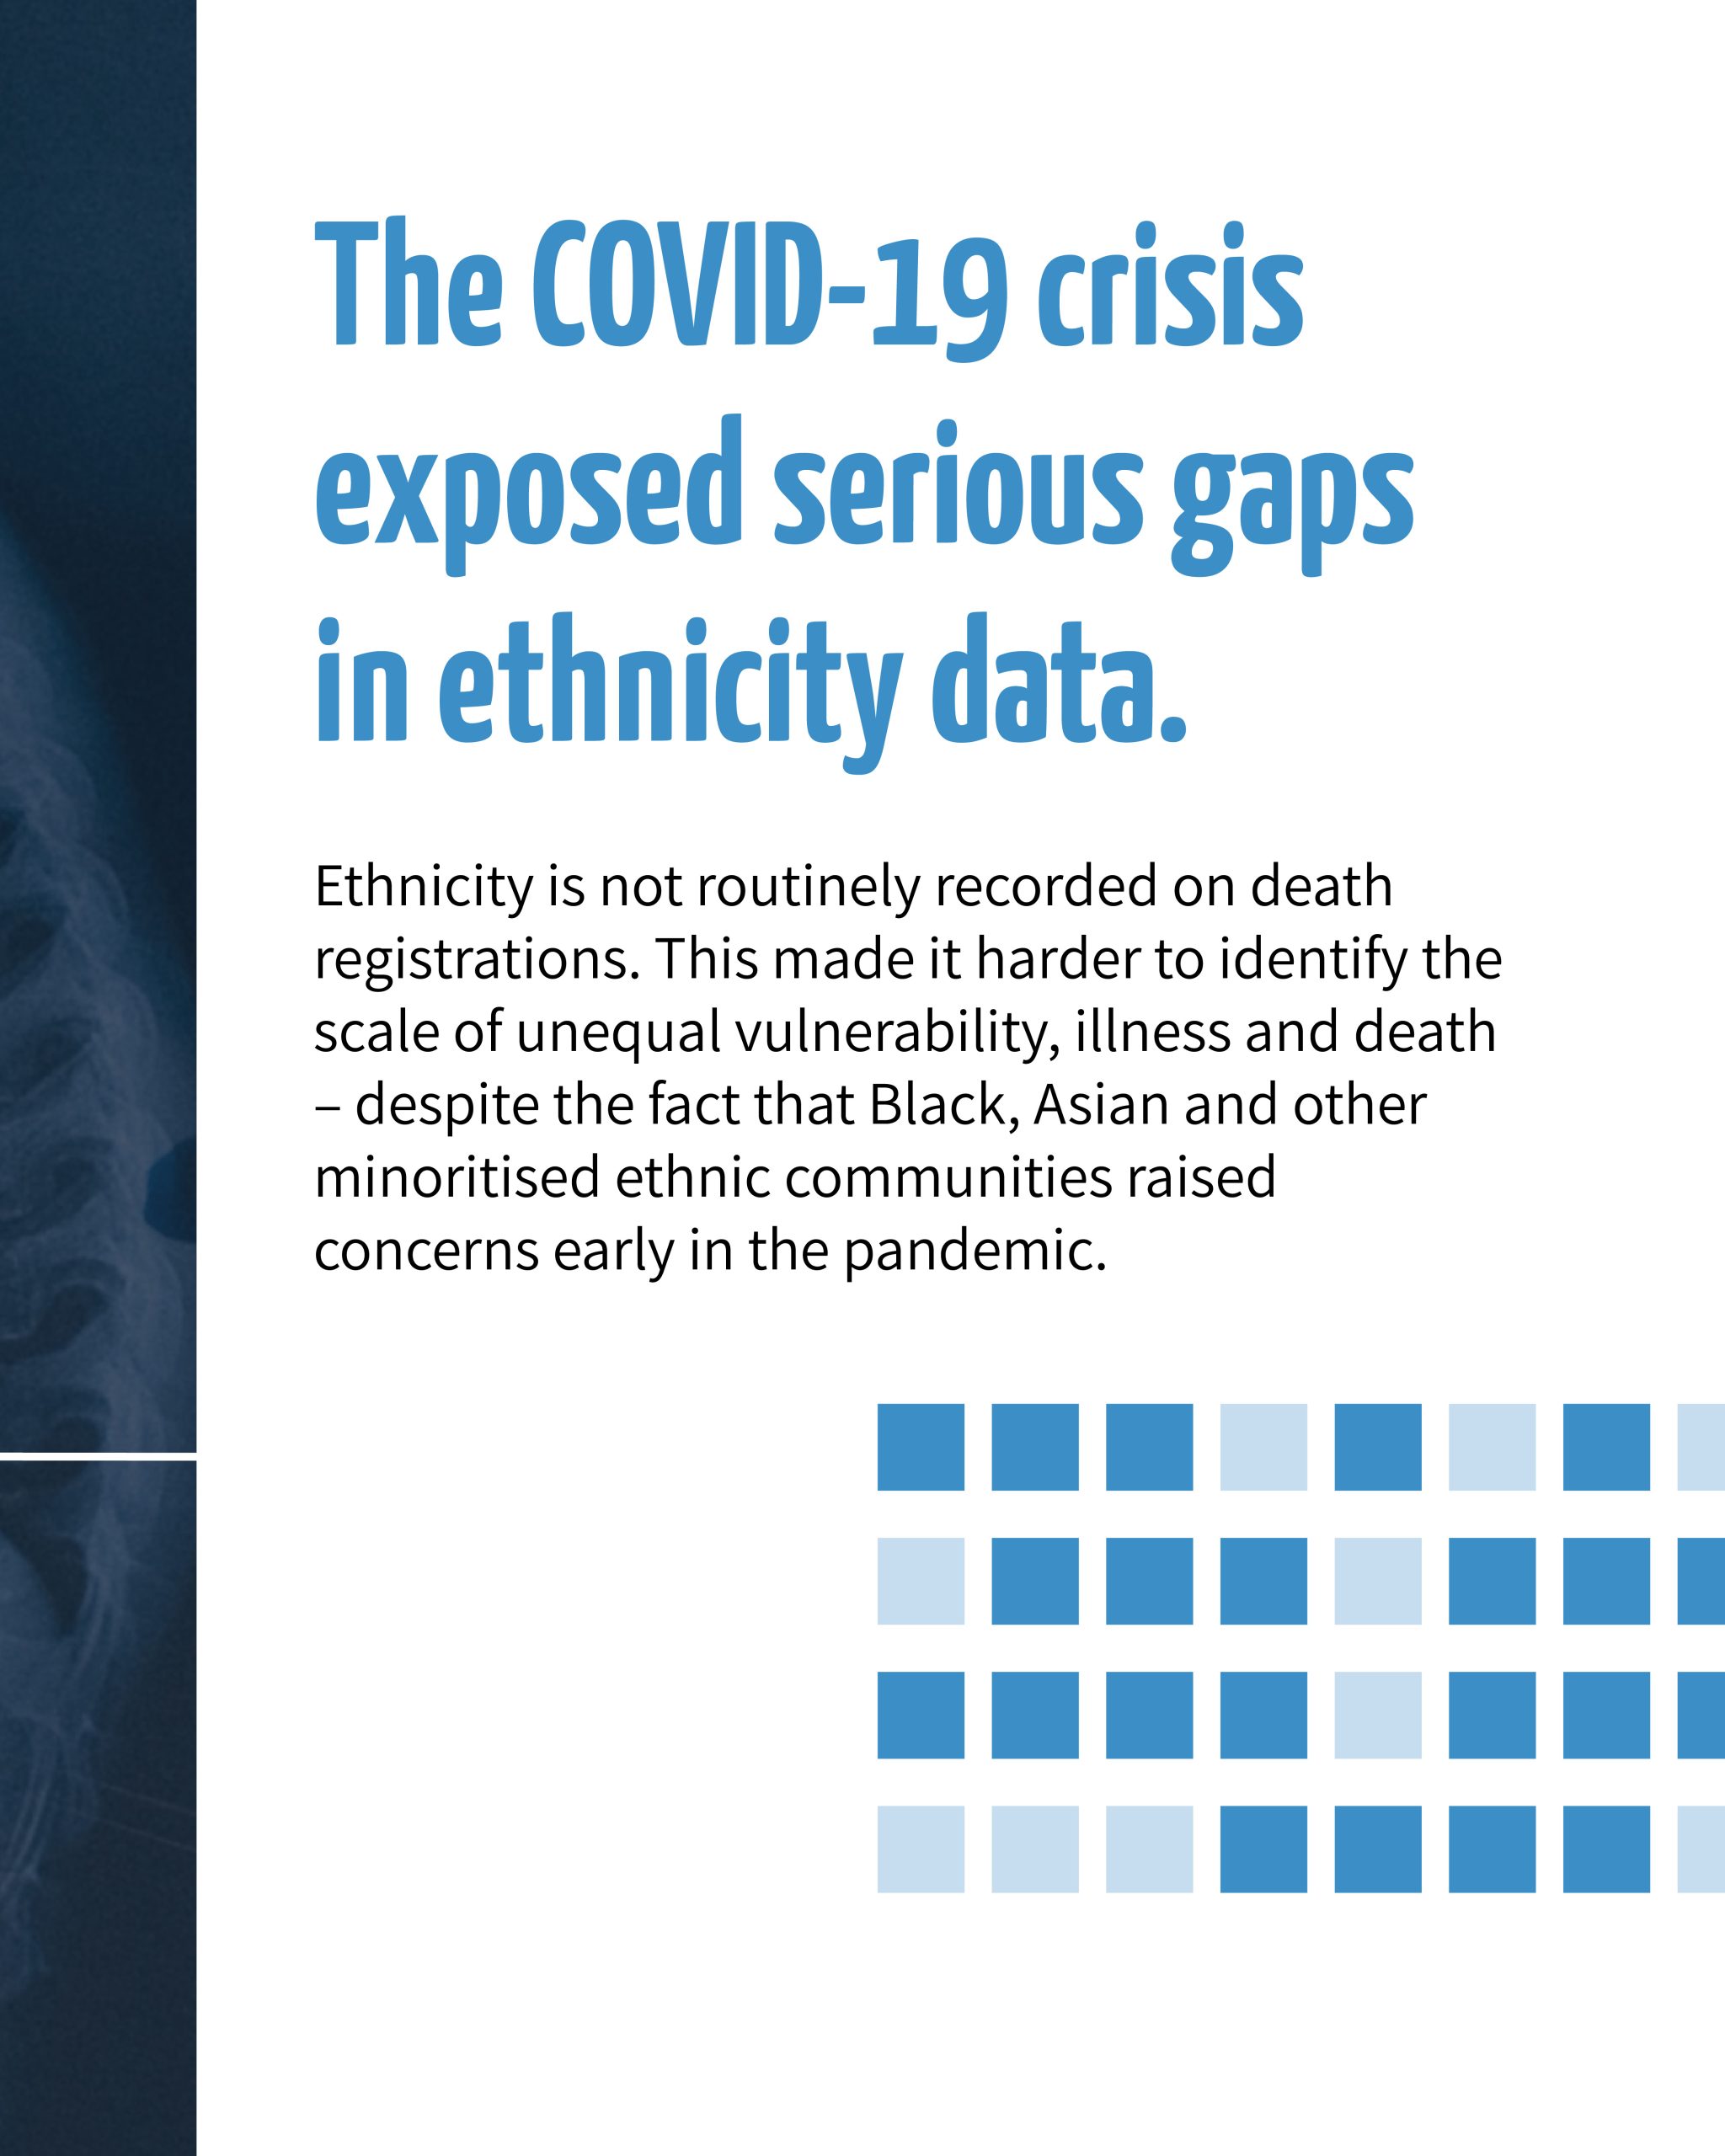
It explains how the COVID-19 crisis exposed gaps in ethnicity data, how the new ONS linkage changes that, and why the headline pattern is not so simple.
The carousel ends with our key takeaway on what an effective response to premature mortality must include.
Key findings
- 1Most ethnic groups have lower age-adjusted premature mortality than White British people.
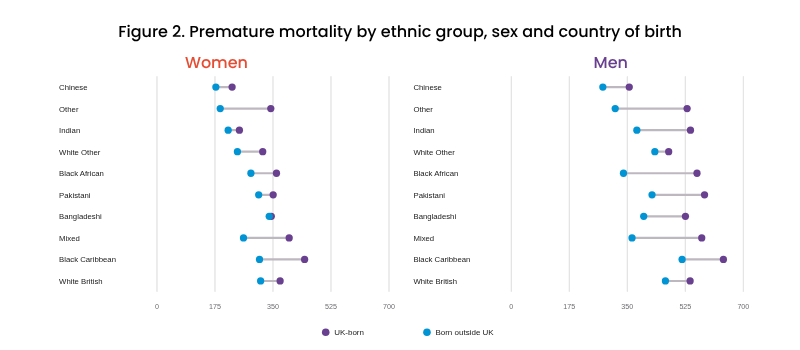
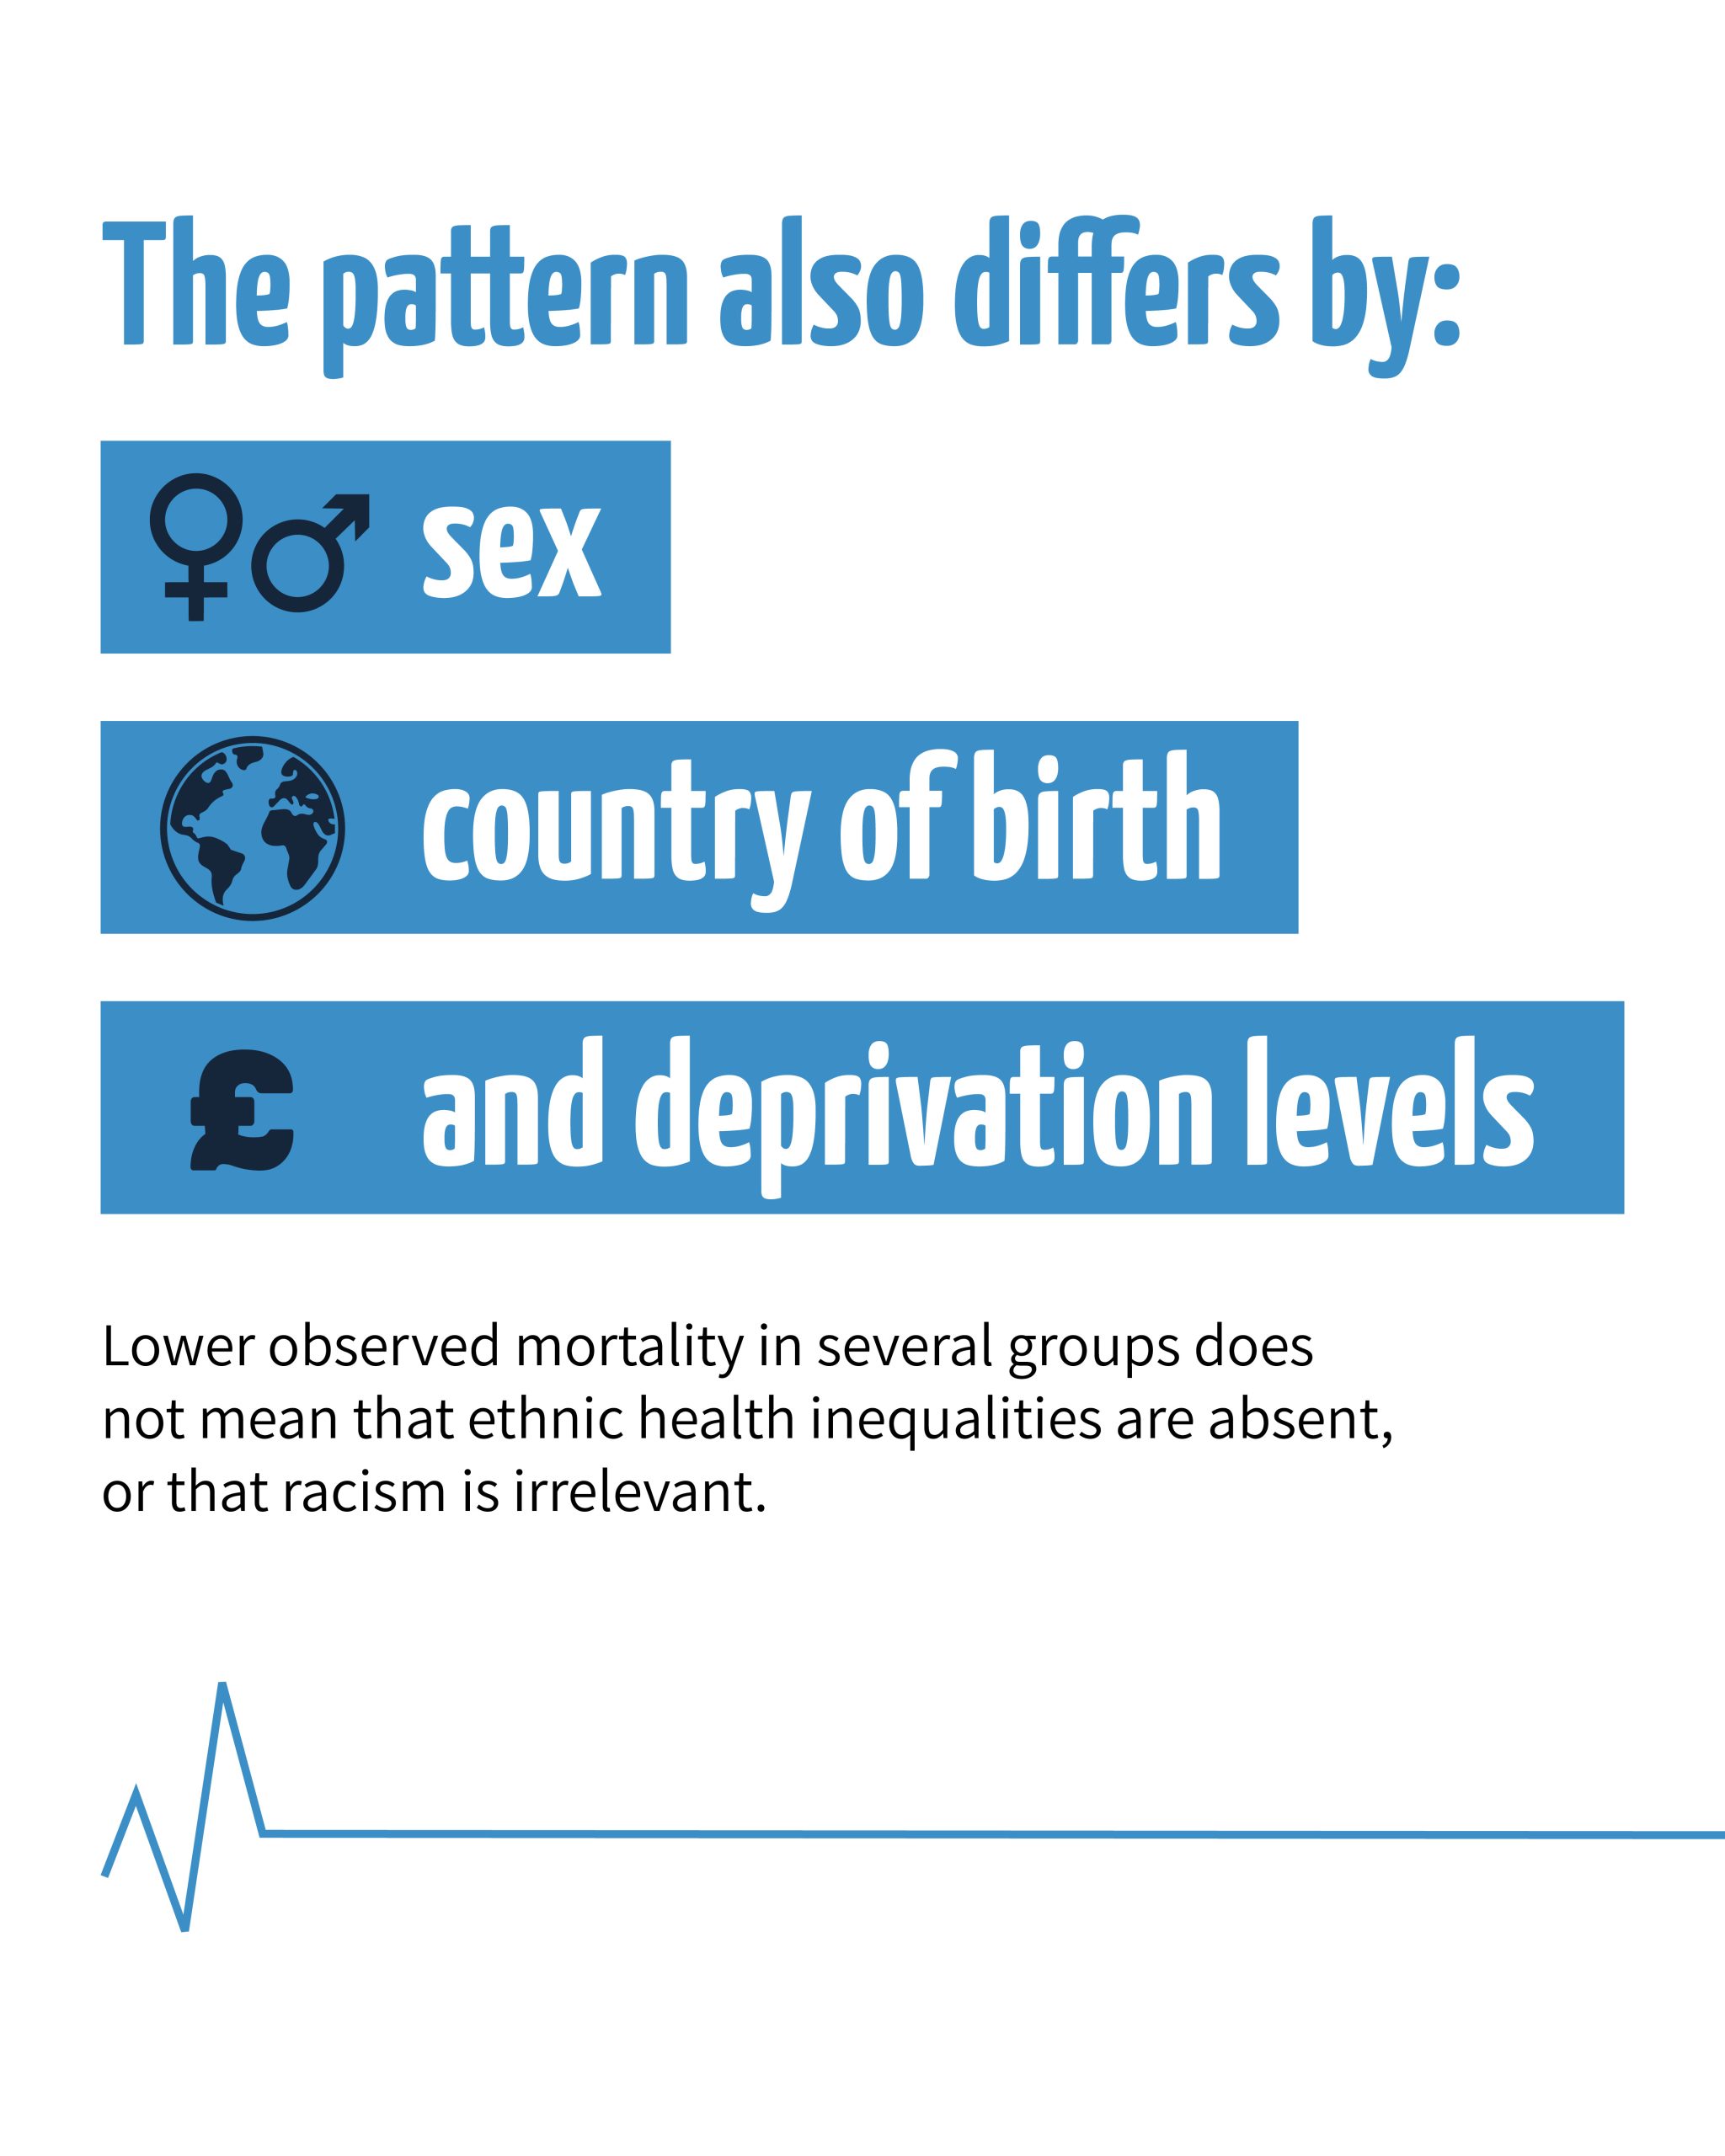
- 2People born outside the UK generally have lower observed rates than UK-born people of the same ethnicity.
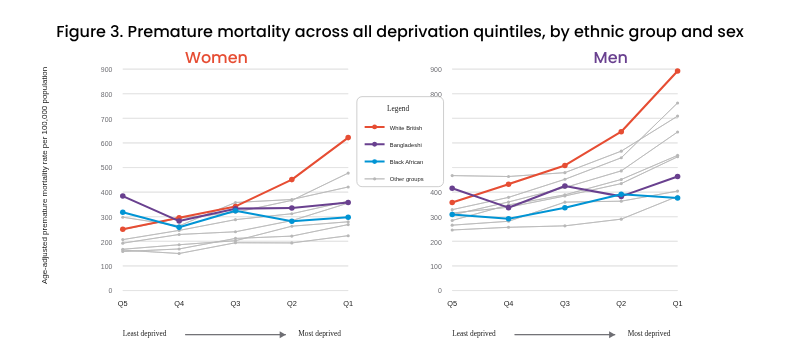
- 3Deprivation gradients differ by ethnic group; the gradient is steepest for White British people.
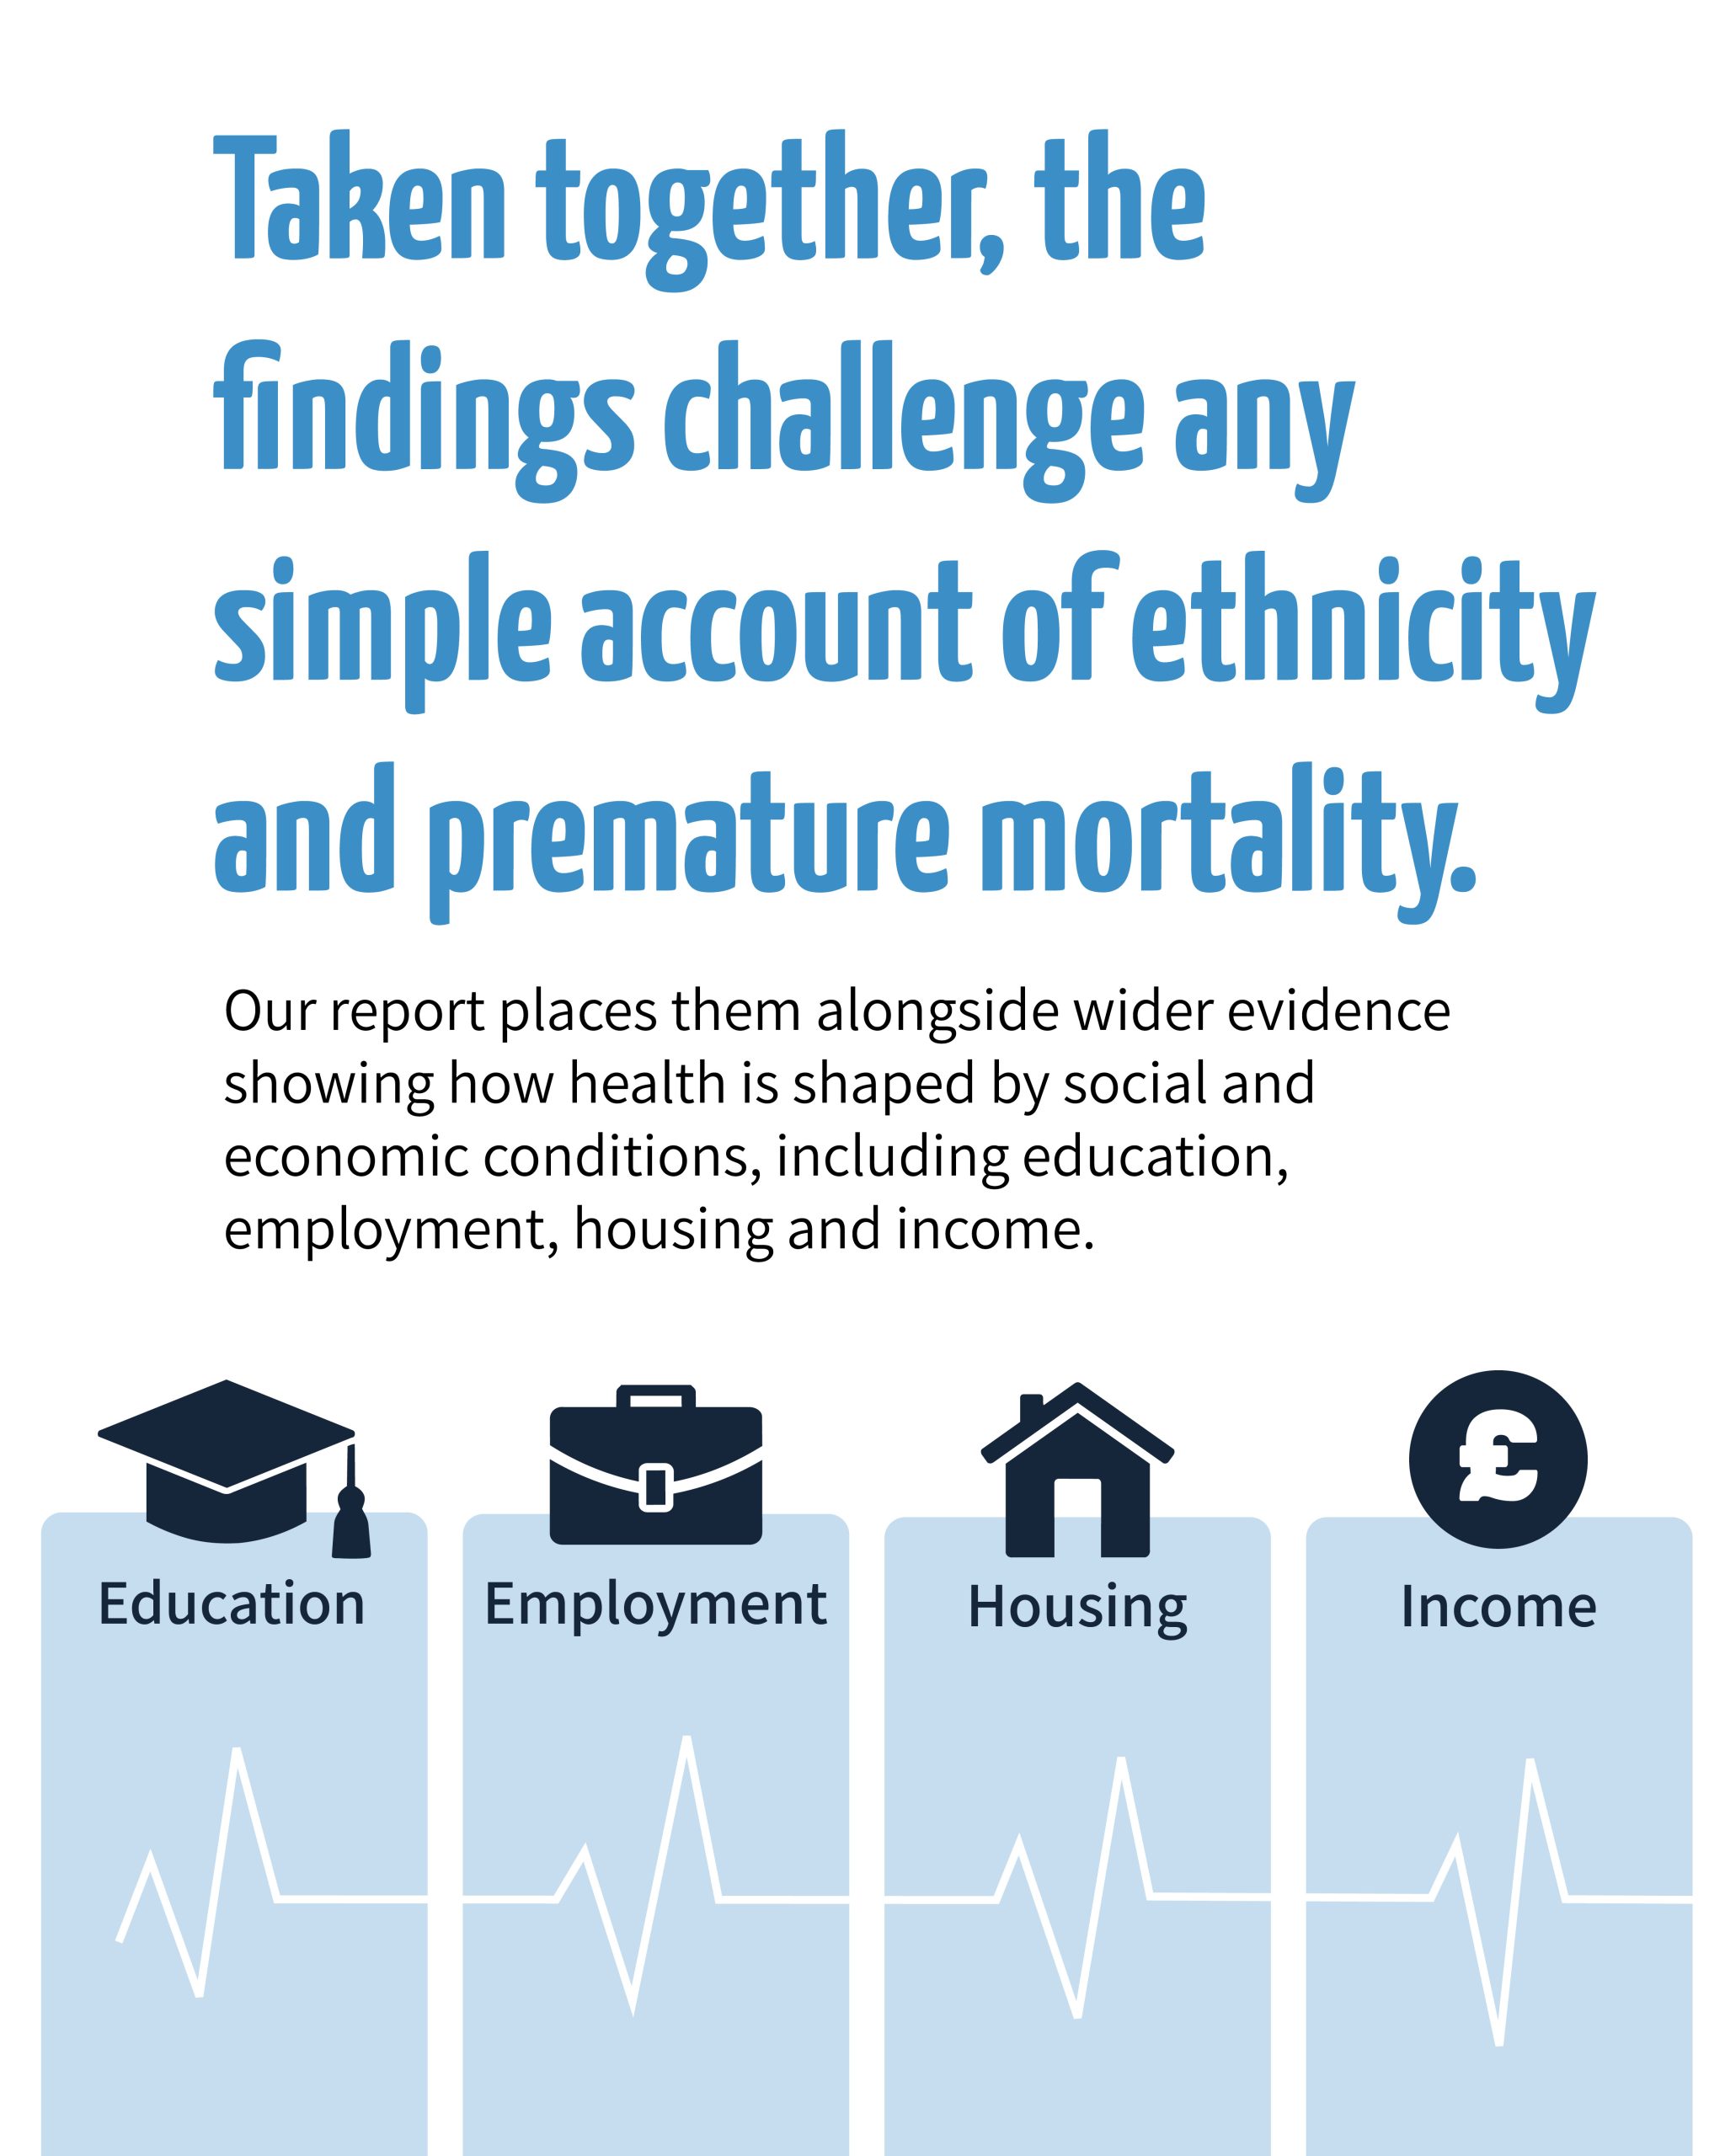
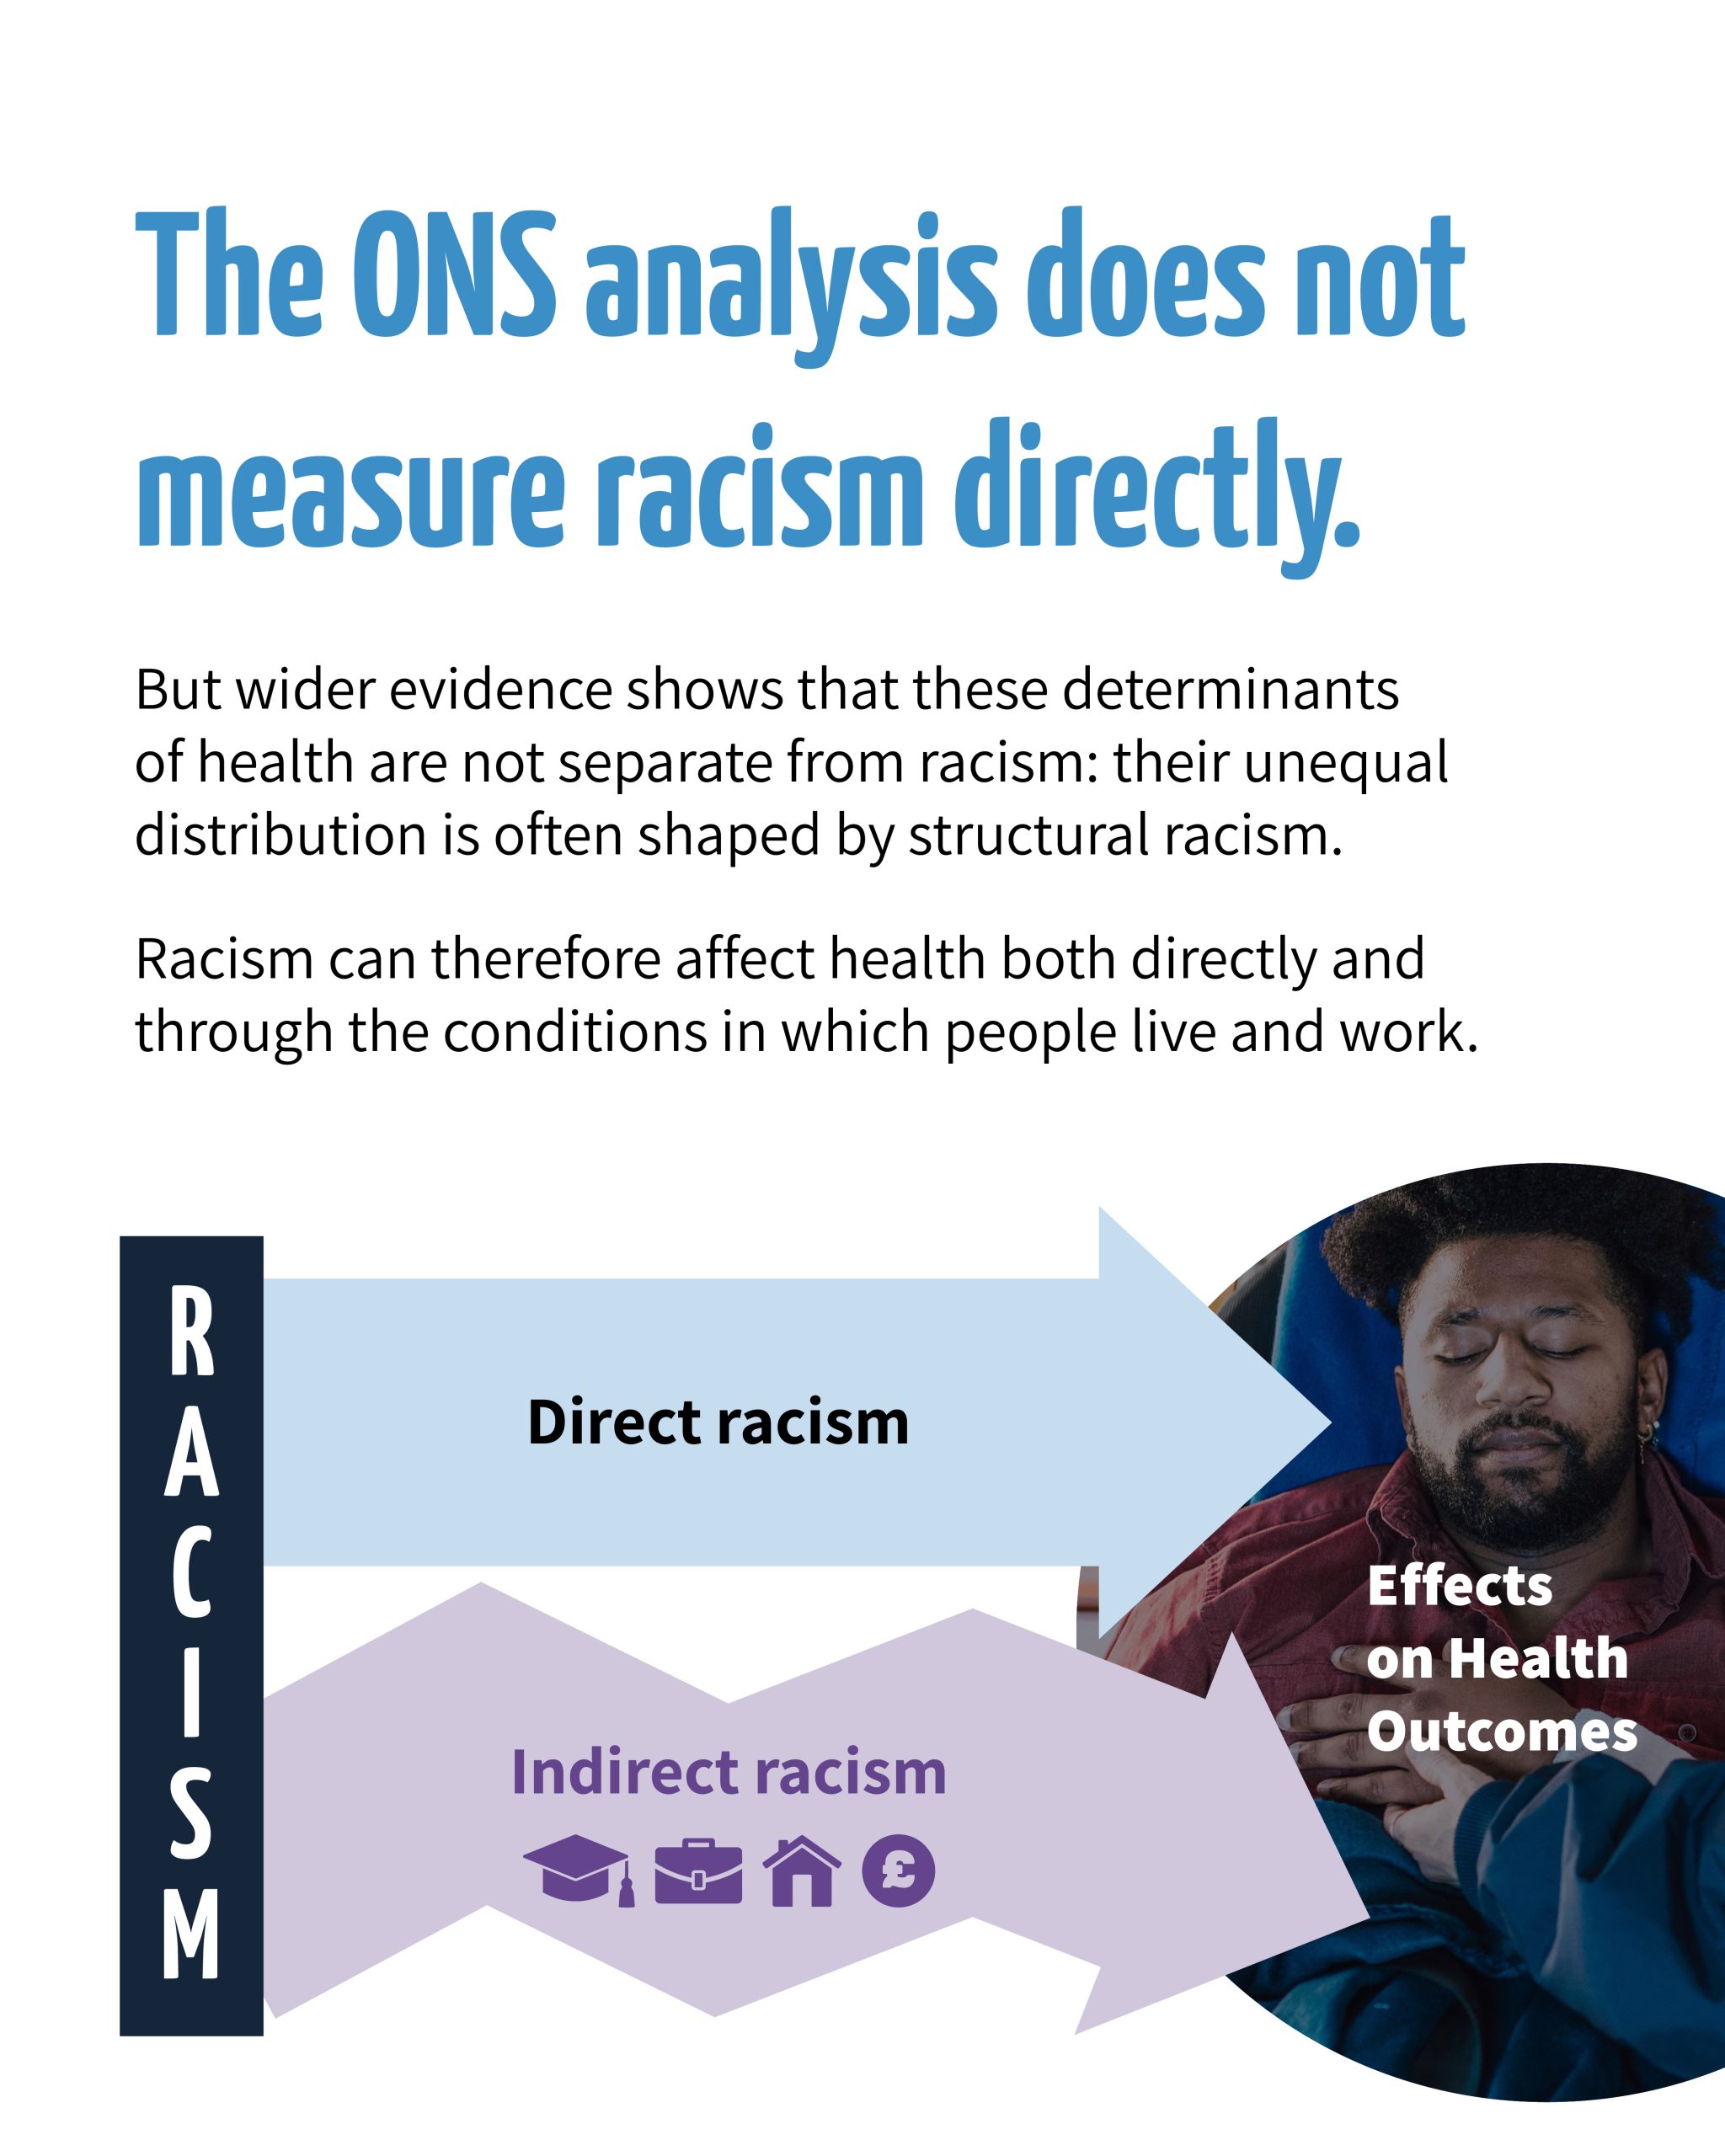
- 4Racism works directly and indirectly, through education, employment, income, housing, neighbourhoods and healthcare.
- 5Adjusting for wider determinants of health doesn’t remove racism from the analysis, because some of these may be pathways for racism.
- 6Action on race equality must include the wider determinants of health.
- 7Action is needed in deprived White British communities, without minimising racism or setting populations against one another.
- 8Ethnicity, country of birth and the wider determinants are interrelated, not competing explanations.
Report figures
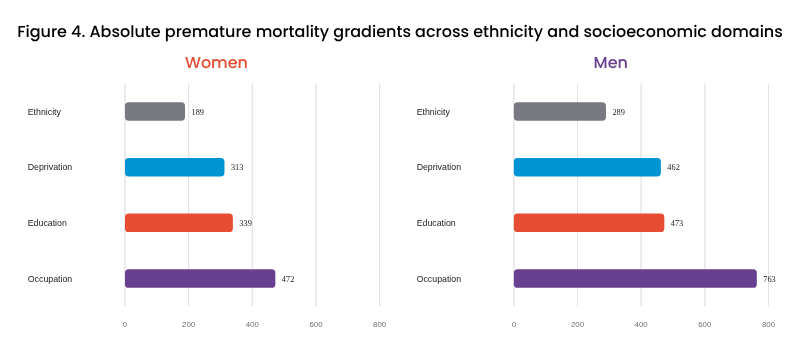
Drawing on linked 2021 Census and death-registration data, the graphs below show:
- Figure 1: Premature mortality by ethnicity and sex
- Figure 2: Premature mortality by ethnicity, sex and country of birth
- Figure 3: Premature mortality across five deprivation quintiles, by ethnicity and sex
- Figure 4: Absolute premature mortality across ethnicity and socioeconomic domains
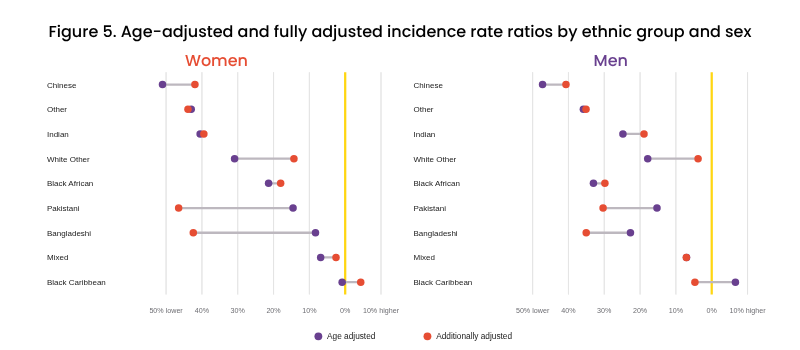
- Figure 5: Age-adjusted and fully adjusted ratios by ethnicity and sex